
What makes Sprockets’ Market Rhythm Bot so special? It’s the synergy between its exclusive indicators and TradingView’s back-testing engine. The result is (almost) an unfair advantage over other market players.
Let’s look at the included indicators.
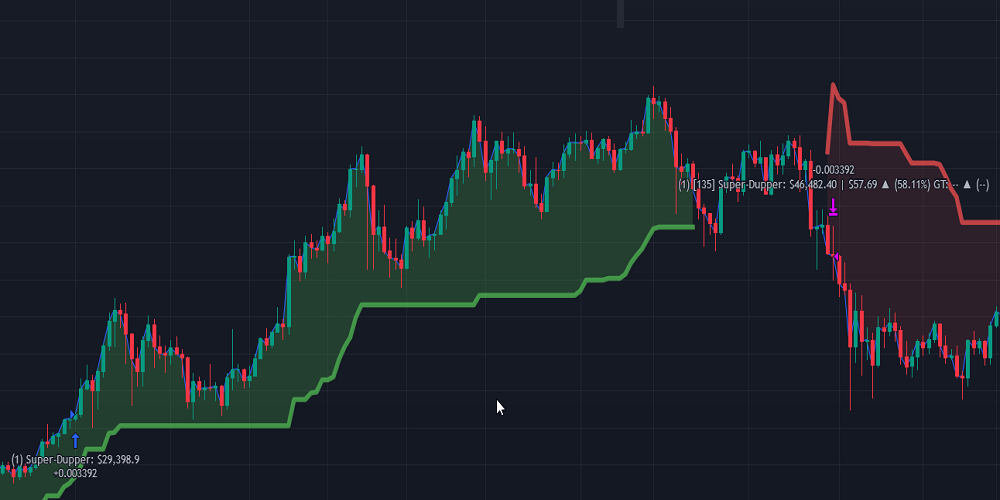
Identify Trends
Spot trends and enter or exit trades and/or prevent other indicators from executing, depending on the trend.![]()
- Super Trend
- Super-Duper Trend
- Slope Change
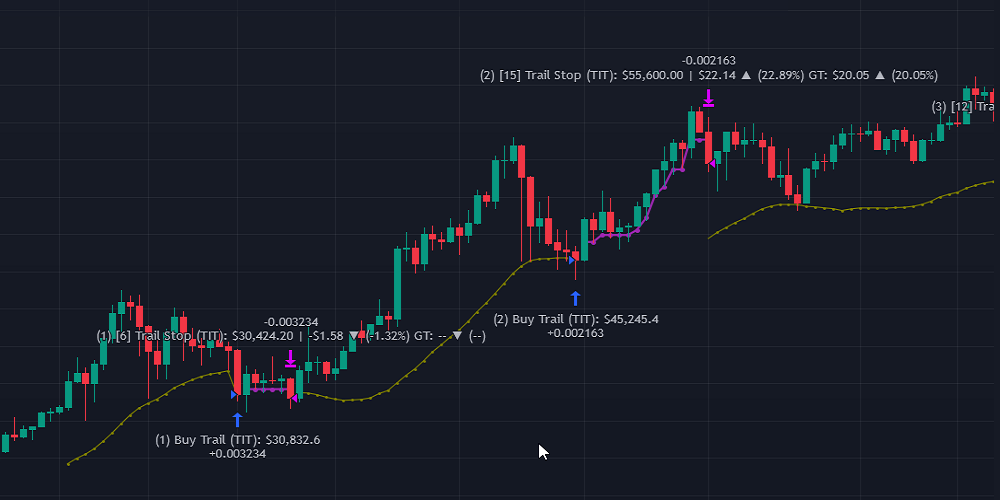
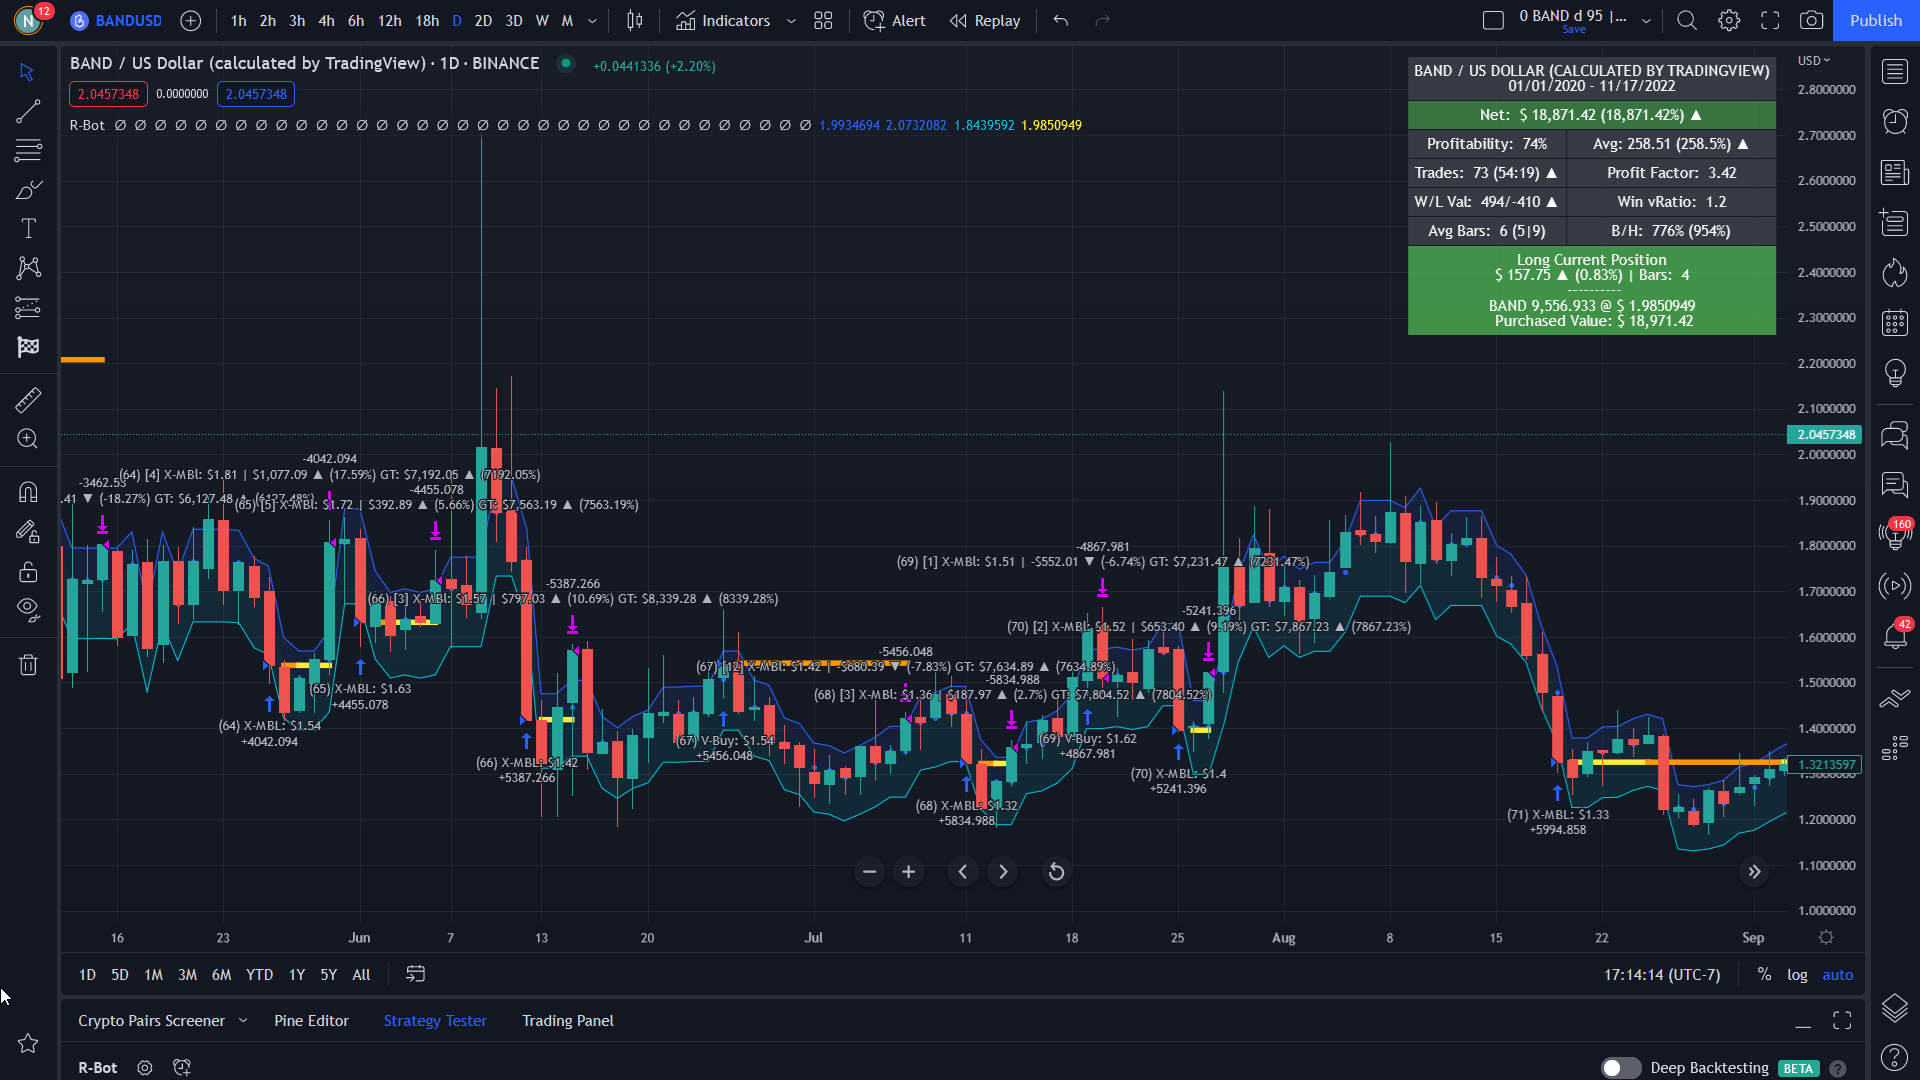
Trailing Buy or Sell
Trailing buy or sell on price, percent change or after your target is met. Identify trailing entries/exits by percent or price using smoothed or non-smoothed changes.![]()
- V-Buy
- Trailing Buy
- Trailing Sell
- Stop Loss
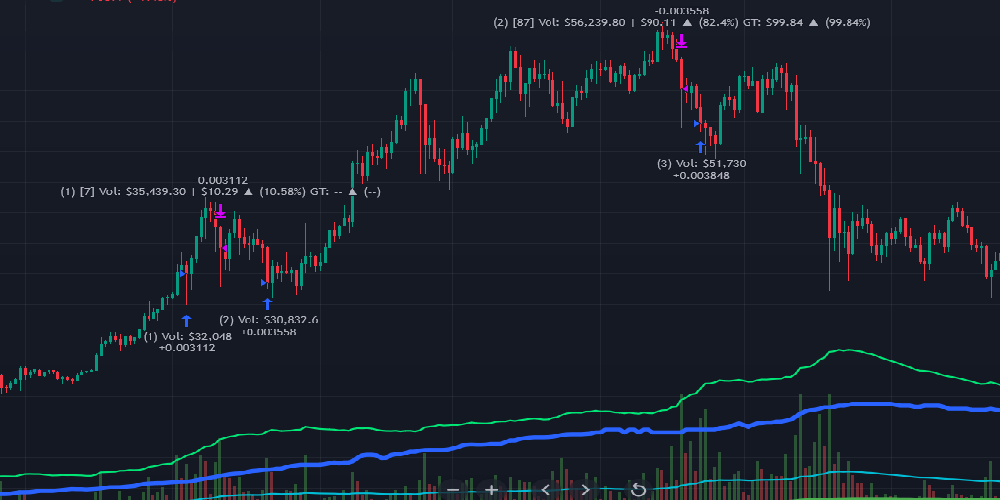
Trade on Volume
Buy or sell depending on volume levels or prevent other indicators from executing unless your volume threshold is me.![]()
- Prevent trades on volume
- Trade on volume
Momentum oscillators
Trade on the most proven oscillators out there.![]()
- Relative Strength Index
- Money Flow Index
- Moving Average
- Exponential Moving Average
- Volume Weighted Moving Average
Loss Safeties
Safeties help to prevent losses in a down or churning market. Choose between two safeties or use both.![]()
- If x-losses over y-periods stop trading for z-periods
- Wait x-periods before buying or selling after a trade
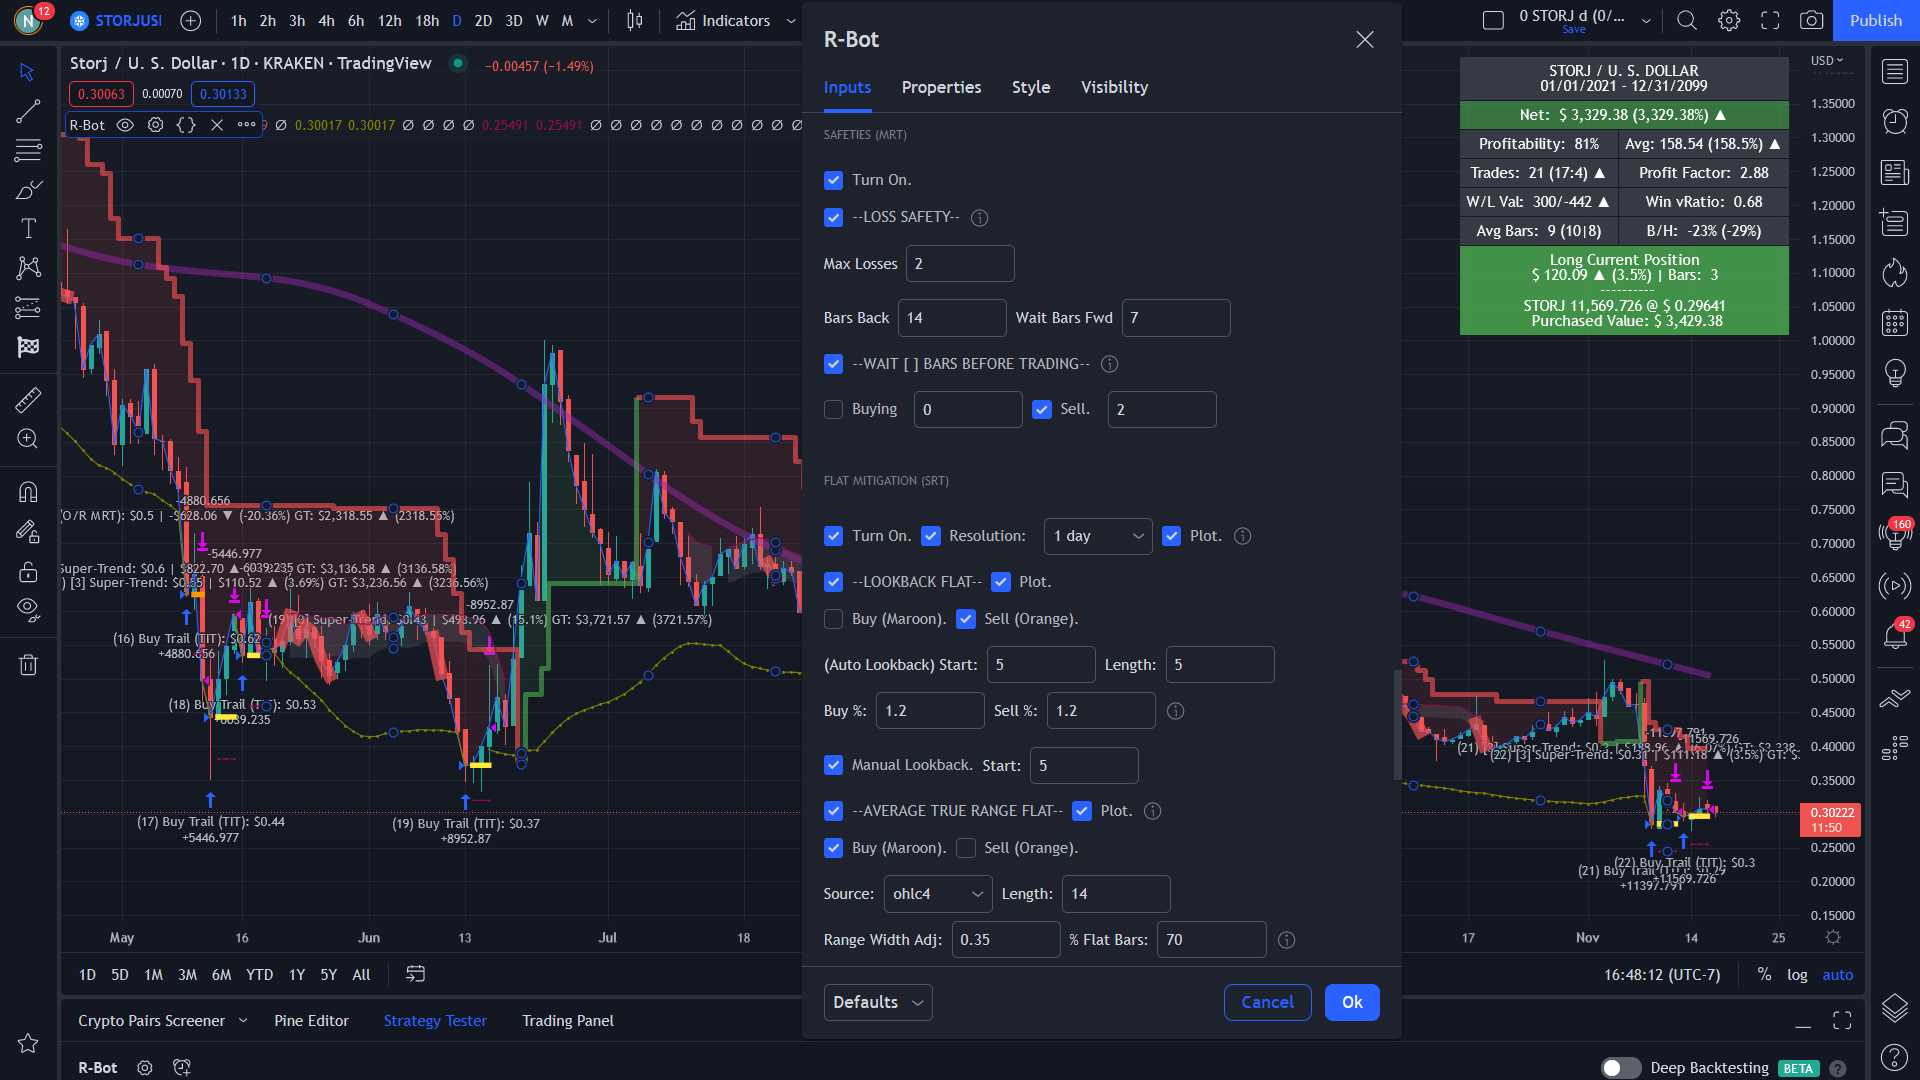
Ranging (Flat) Mitigation
There’s nothing worse than sideways markets or flat candles to slowly drain your account. Flat mitigation to the rescue. These tools prevent trades until the market begins to move, again.![]()
- Lookback Flat
- Average True Range Flat
Baseline Trading
Set your baseline and restrict trading to above or below this line.![]()
- Adjust width/depth of the baseline
- Set baseline to EMA, SMA, or median
- Adjust the width of the “line” to extend the band boundaries
Channel Trading
Trade within a channel to maximize gains.![]()
- Trade when crossing the lower or upper channel
- Execute trades when crossing into, out of, or on both side of the channel boundary
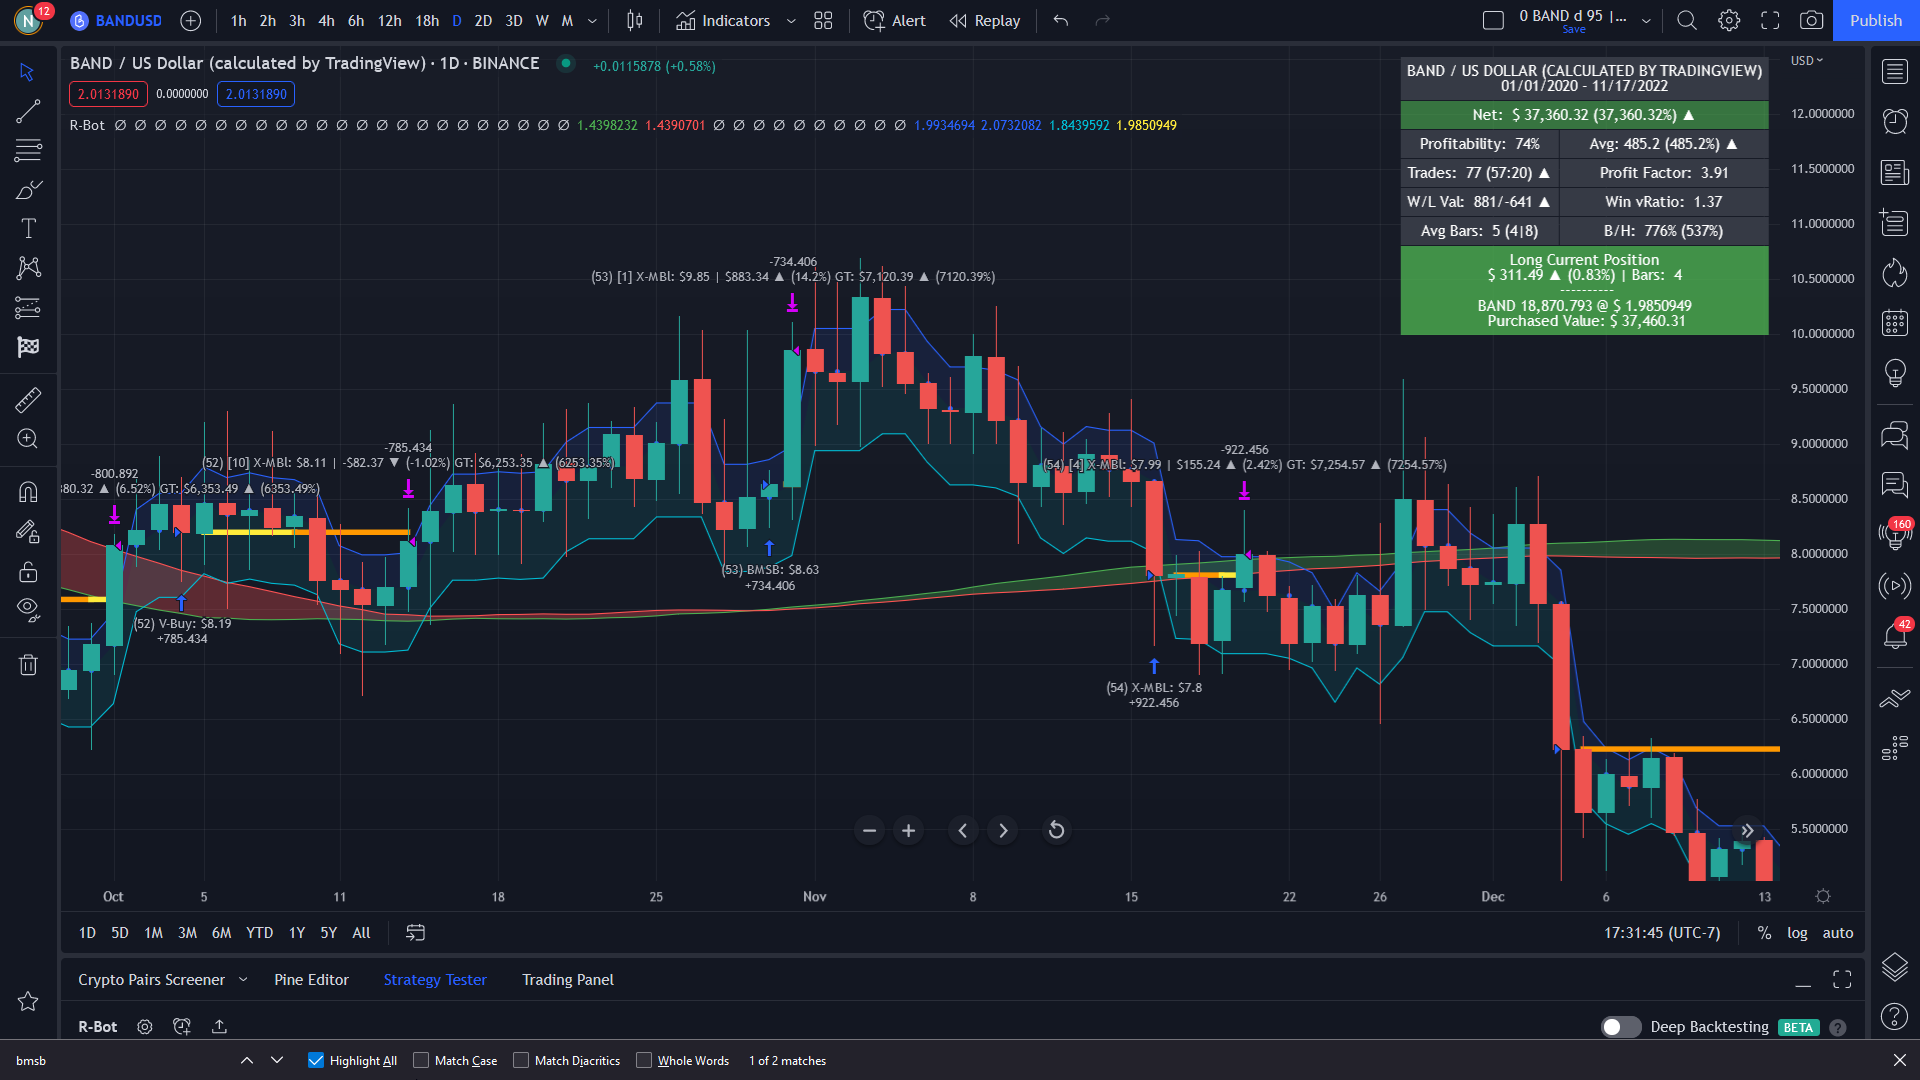
Bull Market Support Band
This is a special take on the SMA/EMA boundaries. Buy/Sell on the fast or slow lines and adjust the lines relative to the other.![]()
- Customize this band to trade at the top or bottom of a trend
- For example, use the 140 period fast SMA and the 2 period slow EMA to identify bull or bear market or execute creative trades
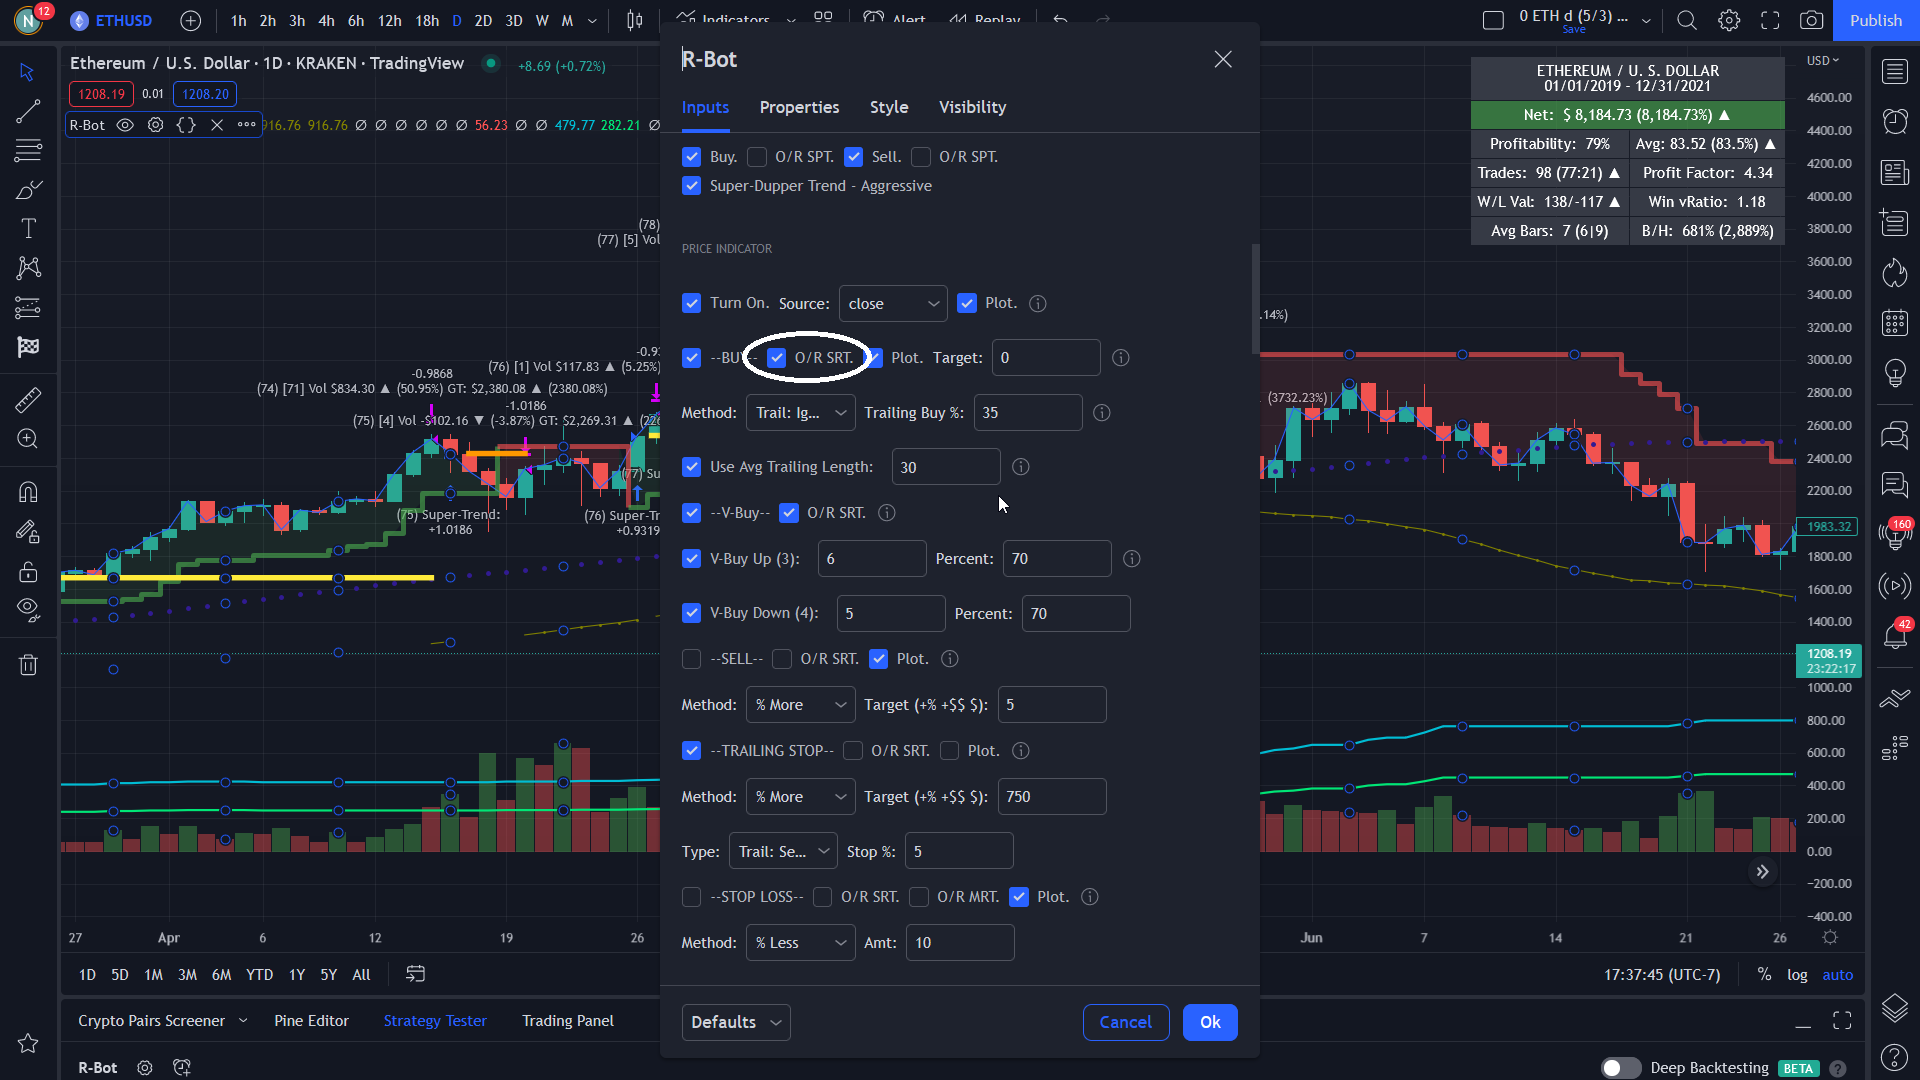
Combine or Restrict
Combine or restrict indicators, oscillators, trends, flat mitigation, etc. to identify unique patterns then back test your strategy.![]()
- Determine if an indicators buys or sells
- Override trends or volume indicators on a case by case basis
- Unique setting that make “boring” indicators shine like never before
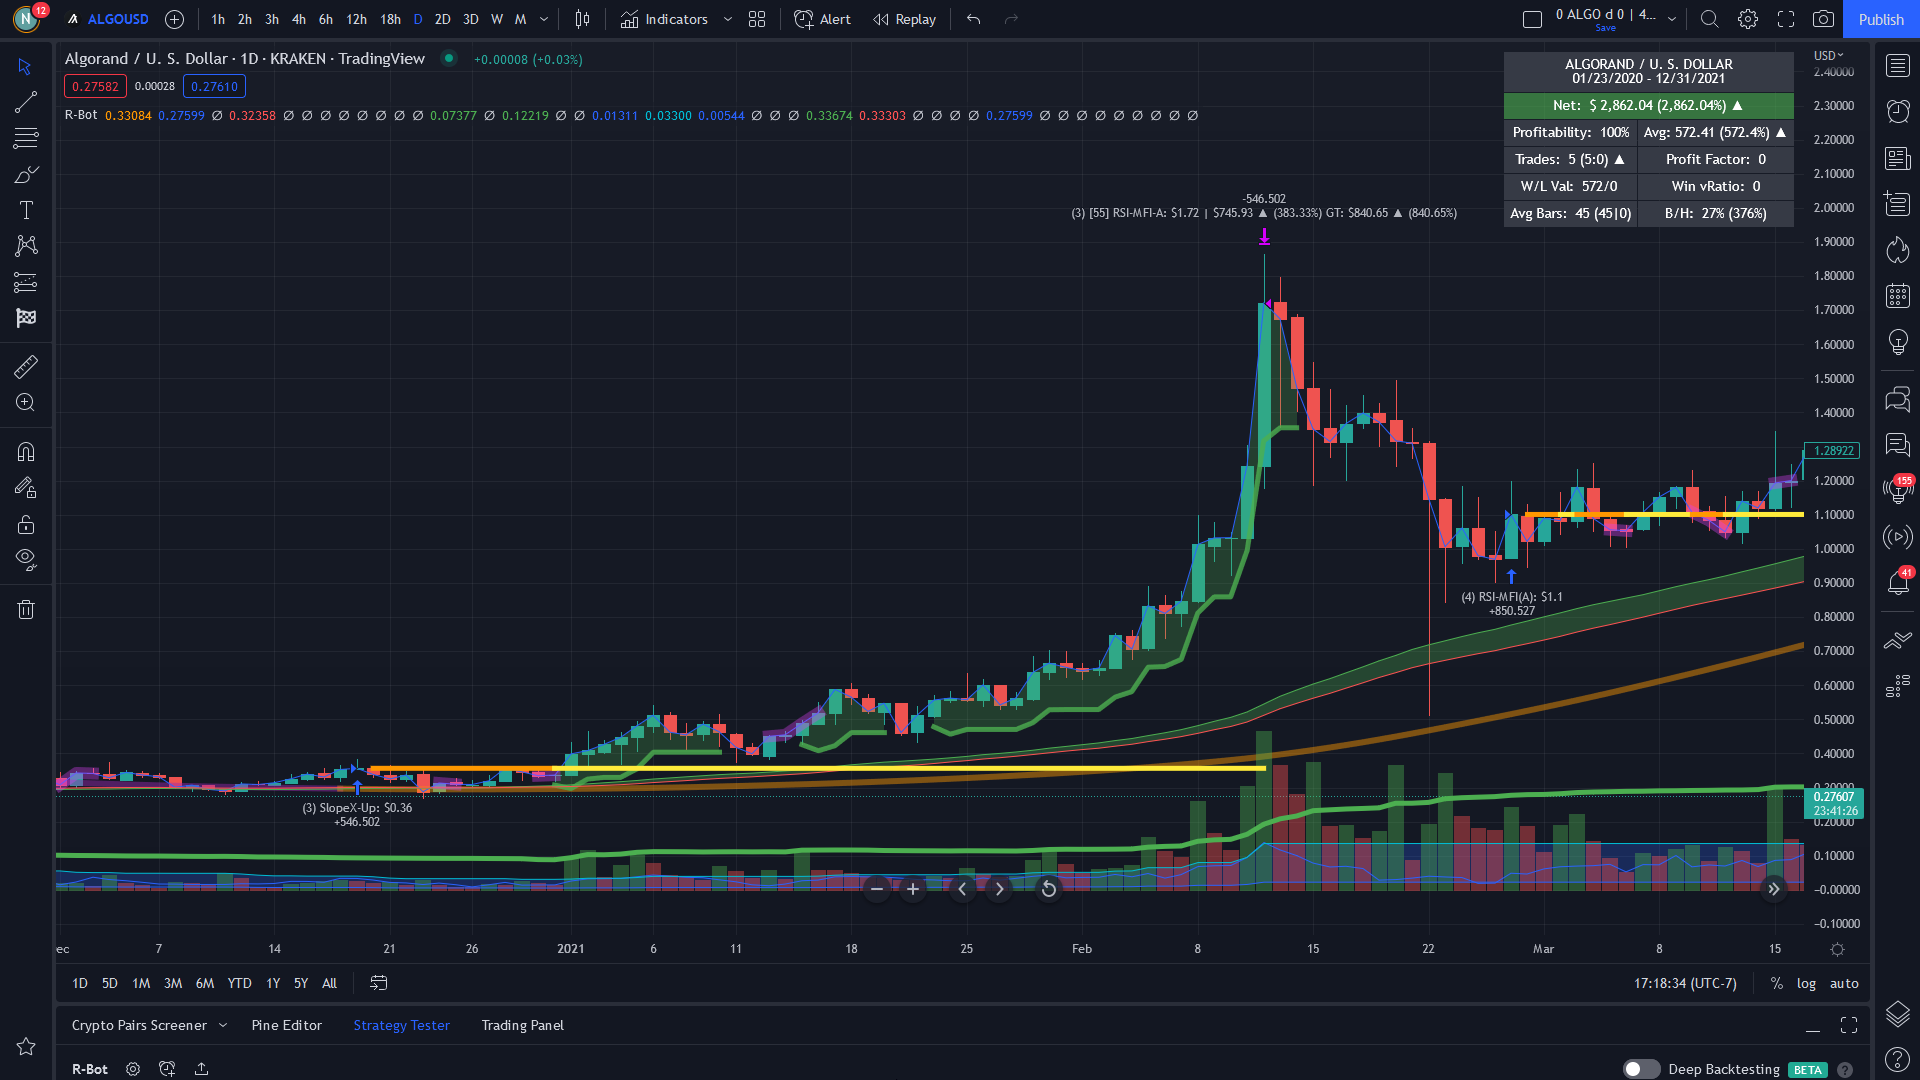
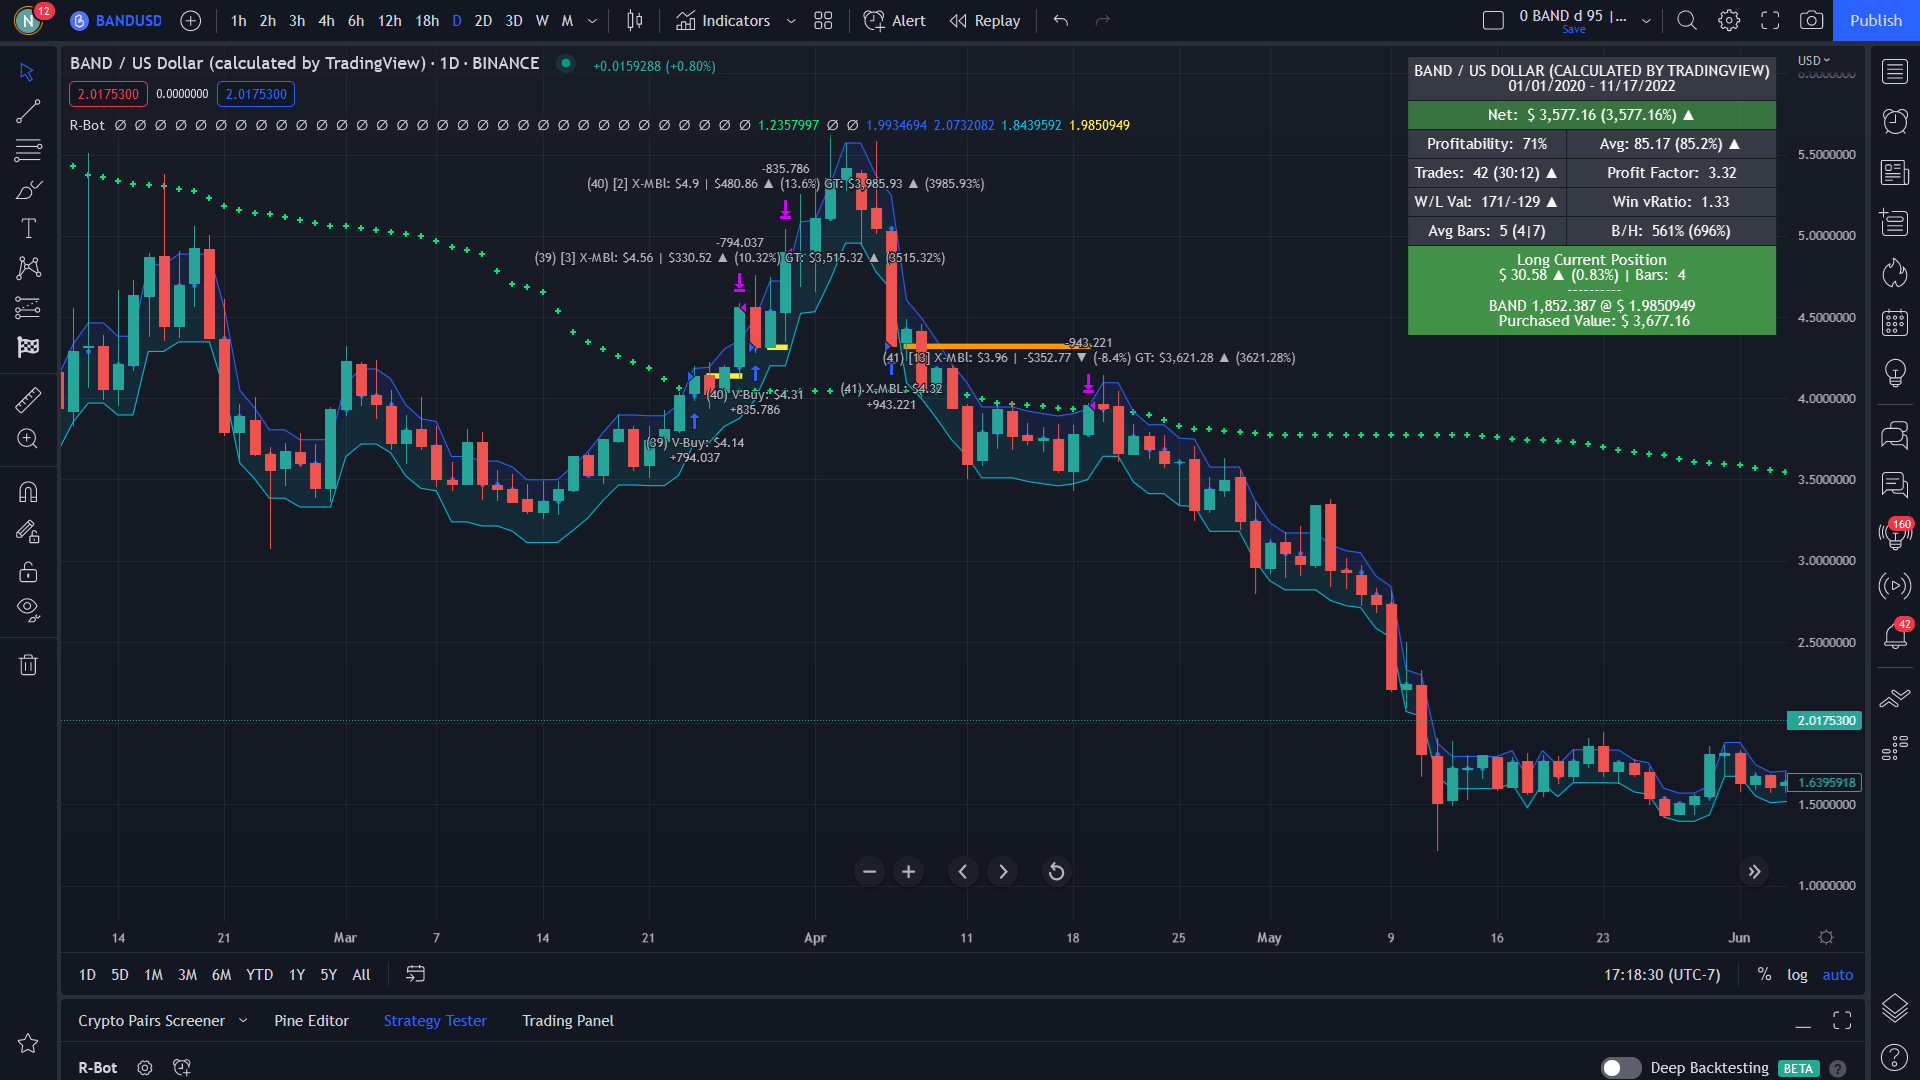
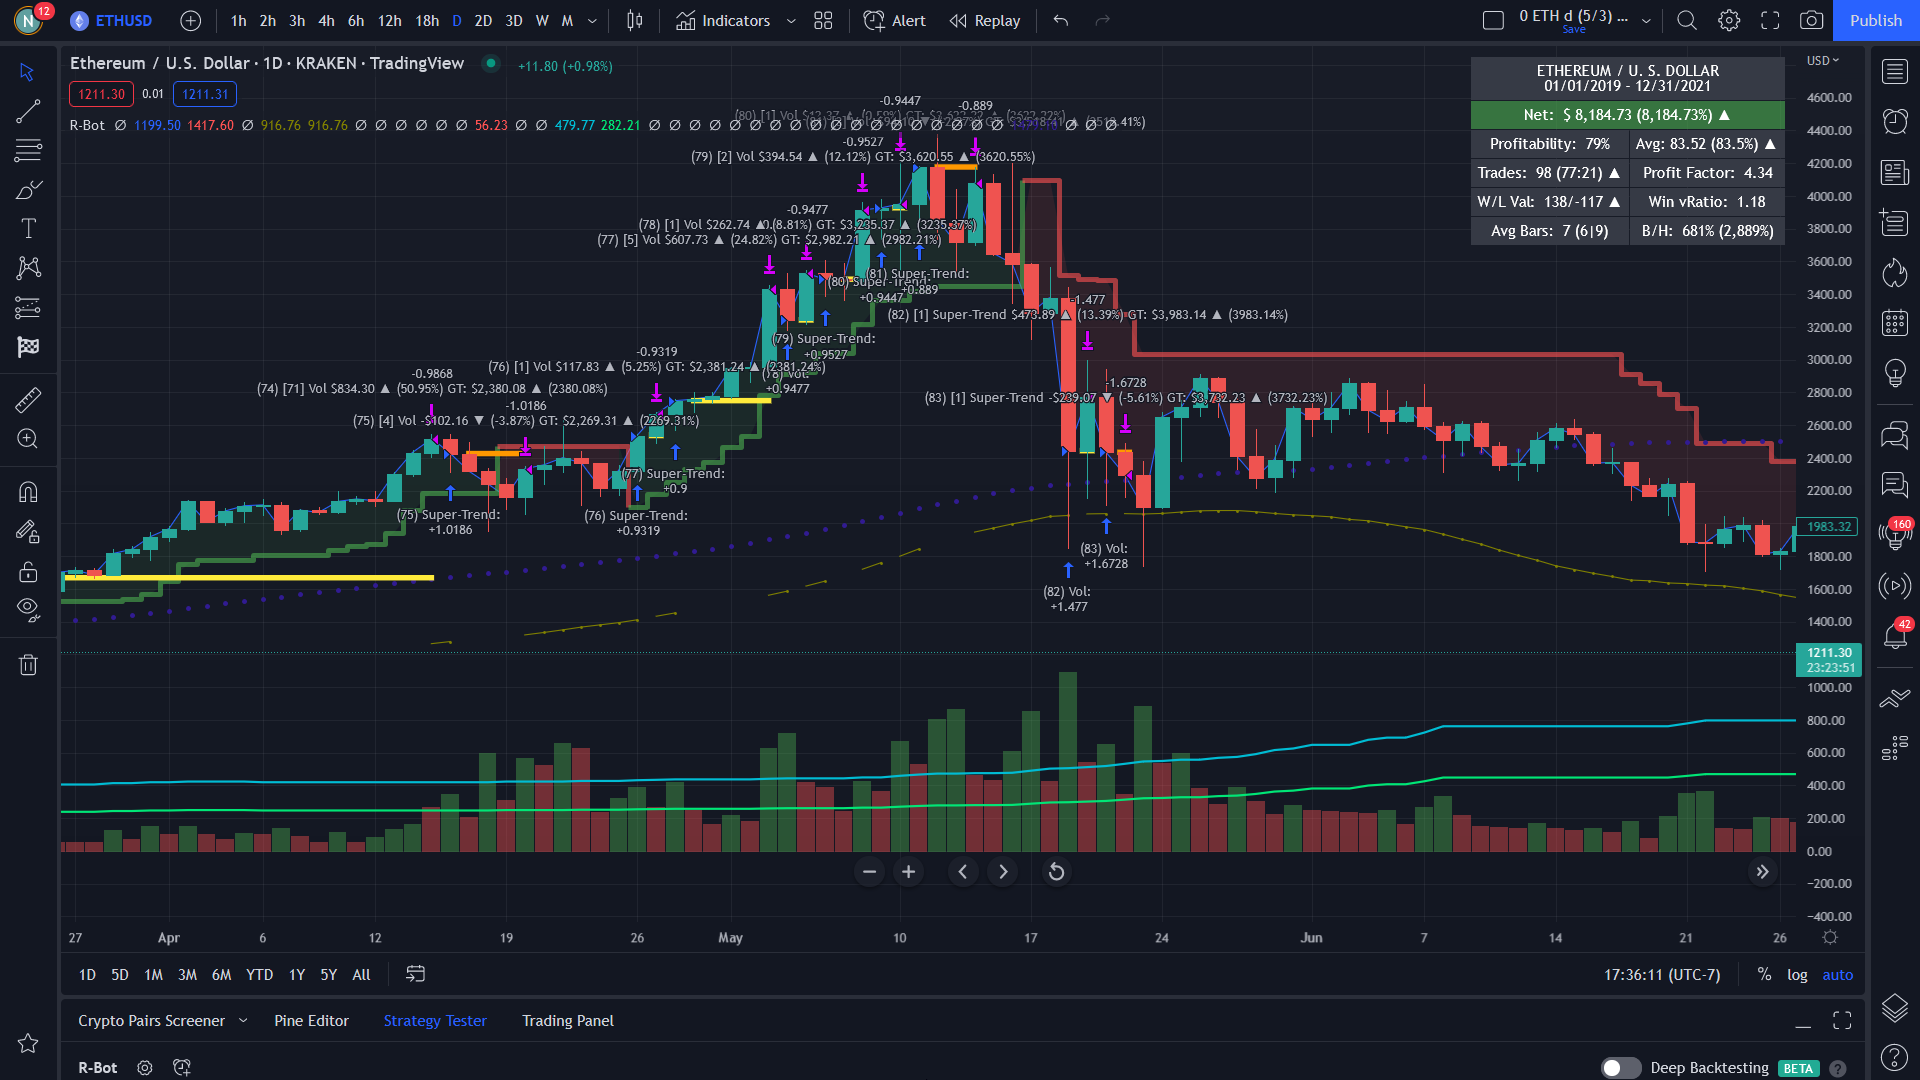
Back Test for Results
We utilize TradingView’s extensive markets breath and historical data with our scoreboard so you can find combinations and patterns that excel like no other bot. Here is a selection of the scoreboard.![]()
- Identify the percentage of profitable trades
- Count the wins/losses, identify the W/L ratio
- Quickly identify the average trade profitability, the Profit Factor, the Win/Lose Value Ratio
- Quickly gage your strategy by comparing hodeling with your strategy
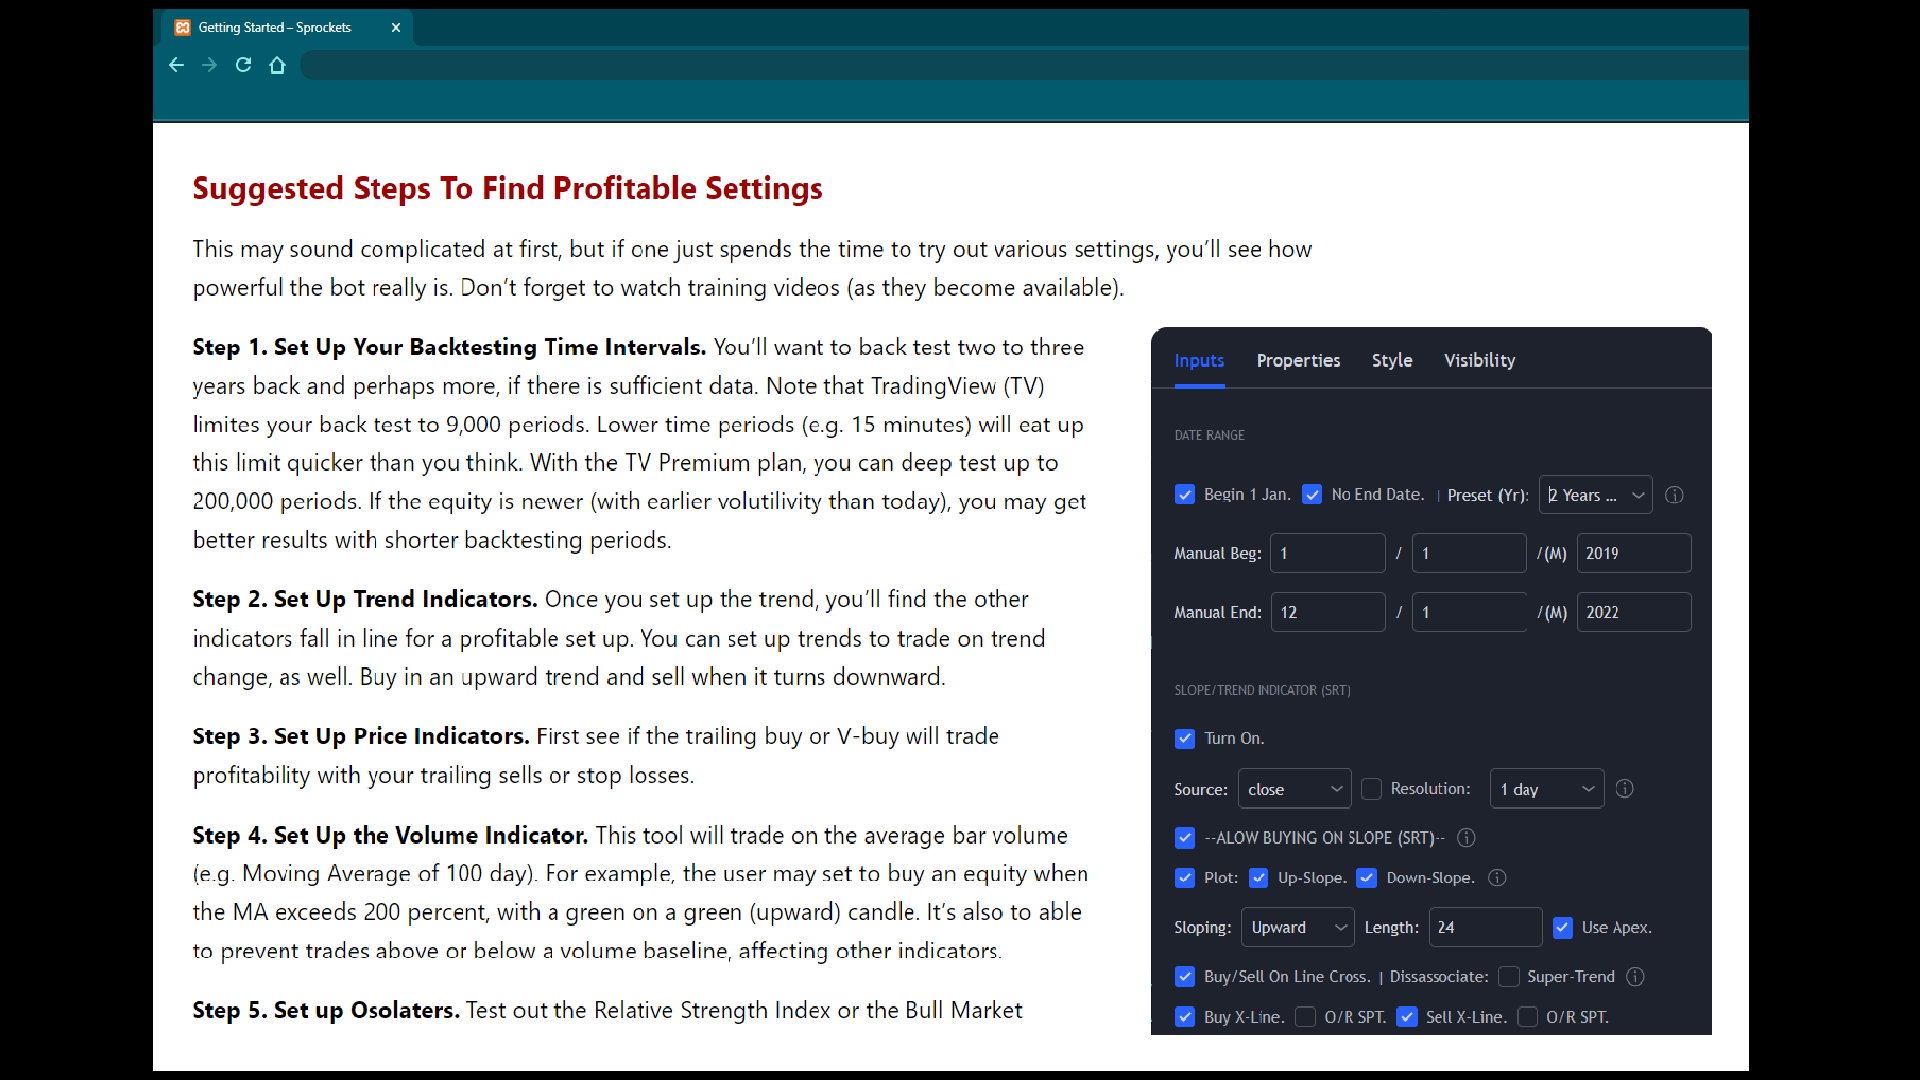
Getting Started
It can take some time to set up Sprocket’s market-rhythm bots. The bot has many interacting indicators, oscillators, etc. that form the whole of the bot. The “rhythm” setting is what makes the bots so successful. To get you started, we include: ![]()
- Use our crypto bot setting to get you started.
- Review our training videos (we’re just getting started).
Next: Check out the Frequently Asked Questions (FAQ) page for some Q and A.