
Sprocket’s Market Rhythm Bot is customizable to each crypto or equity. The bot includes tools to identify trends, momentum, flats (ranging sideways), trailing buys/sells, stop losses, volume indicators, and more.

The bot runs scripts within the TradingView
environment.
To fully utilize the bot a TradingView plan is required.
Once subscribed, this is how to find the bot on TradingView![]() .
.
It takes patience and time to find the best settings. Each “tool” within the bot interacts with each other. Once you’re experienced, it may take 20 to 30 minutes to find profitable settings. For the novice, it can take two to three times as long to find a setting you’re comfortable with. It’s also unlikely one bot setting will work with all equities or cryptos.
To get you started, we include our most recent bot settings for Bitcoin and Ethereum (for subscribers only).
Note: We’ll use the term “equities” when discussing instruments traded, regardless if its a stock, crypto, future, etc. It just makes reading easier.
How to Finding the Market’s Rhythm
The Scoreboard. This is generally displayed in the top left corner. Use it to identify the profitable setting that works for your goals. Here’s how to read the Scoreboard:
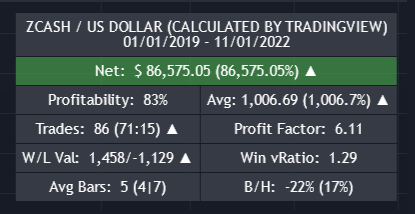
- The Net (wins/trades) is shown in both currency and percentages. Obviously this is an essential record of the bot’s success. In Figure (1), the currency and percent numbers are the same because we began trading with $100.
- The Profitability (winning trades / total trades) score tells you the overall success of your bot settings. Some users like to keep the profitability setting over 70 percent. Others, who are more risk adverse, prefer Profitability of 80 or 90 percent.
- The Avg [Average] includes two numbers, the net profit of all trades and the average gain/loss per trade.
- The Profit Factor (gross profit / gross loss) is an easy way to compare or identify profitable setups. A factor of 1 or less is risky (1:1 even); 2 is good (2:1 profitable); and 3+ is very good
- B&H [Buy and Hold] is a useful statistic. There are two numbers, the first one is the hypothetical profitability if you simply bought at the start of the time period setting and sold on the most recent candle or bar. The second number (in parenthesis) is the hypothetical result, if you bought at the start time period and held until the bot’s last exit. No one can perfectly time the market, but this will tell you if your bot is as good as hodeling (holding).
- There are other statistics on the scoreboard. Just hover over the item to learn more about it.
The Effect of Volatility and Time Periods. Here are a few things to consider when configuring a success bot strategy.
- Too Volatile. Before we begin, it’s important to understand that some equities are simply too volatile to find a profitable market rhythm. If you cannot find a profitable setting (rhythm), it might be better to try another equity.
- Back Testing. The market tempo changes with time. Though it’s important to include as much time-based back testing as possible, it may be just as prudent to test earlier time periods as well (e.g. back test one year or so). Some setups work best with longer back testing periods, but if you find it difficult to configure a profitable bot, the user might consider focusing on shorter time periods.
- Candle Periods. In general, the shorter the candles (4 hour, 12 hour, 1 day, etc.) , the less likely you’ll find a suitable market rhythm. Longer periods tend to smooth out the market’s volatility–and because of this, our preferred candle period is daily. Experiment to see what best works for you.
- Emphasis on Shorter Time Periods. It’s up to the user, but we like to put more emphasis on the earlier time periods than the later time periods. There’s nothing worse than watching your new bot setting become unprofitable because you didn’t test it in a shorter time period, as well. This consideration is especially important during bear markets.
- Profitable Long-Term Periods. You’ll often find it possible to get much higher earnings with more risk (profitability under 60 or 70 percent) for longer periods (one or two years out, if you’re a daily candle trader). As discussed in the previous paragraph, a long-term investment time horizon will often have intermediate periods of large losses. Moreover, some small-cap equities and cryptos may have large run-ups and then a crash. Some may never return to their highs.
- Down Markets. Since we didn’t design the bot for shorting, it’s often best during long bear markets to simply stay out of the market until a confirmed bull market has begun. Again, it’s up to the user, but it’s possible to find set ups in long-term down markets that take advantage of bear market rallies. See Investopedia’s article, What Is a Bear Market Rally? What It Is, How It Works, and Example, for more information.
Suggested Steps to Find Profitable Settings
This may sound complicated at first, but if one just spends the time to try various settings, you’ll see how powerful the bot really is. Don’t forget to watch training videos (as they become available).
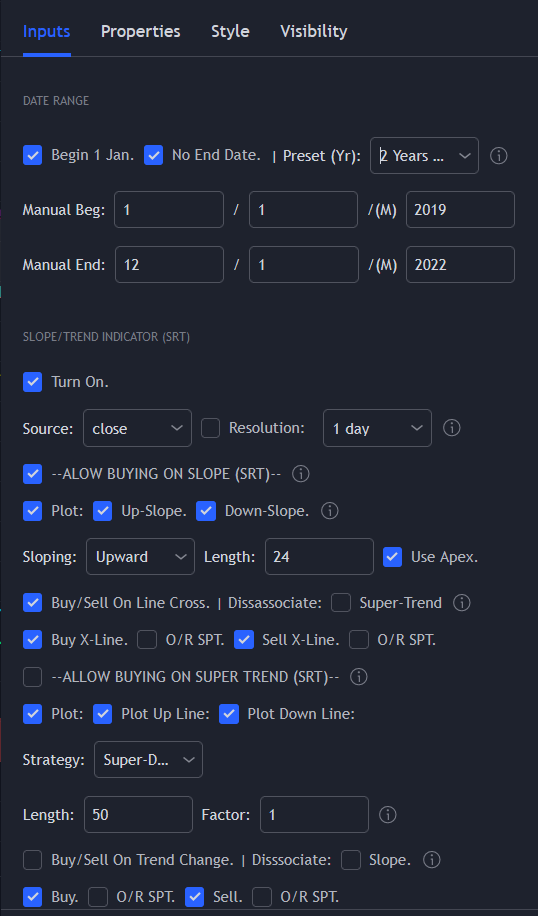
Step 1. Set Up Your Back Testing Time Intervals. You’ll want to back test two to three previous years and perhaps more, if there’s sufficient data. Note that TradingView (TV) limits your back test to 9,000 periods. Lower time periods (e.g. 15 minutes) will eat up this limit quicker than you think. With the TV Premium plan, you can deep test up to 200,000 periods. If the equity is newer (with earlier volatility than today), you may get better results with shorter back testing periods.
Step 2. Set Up Trend Indicators. Once you set up the trend, you’ll find the other indicators fall in line for a profitable set up. You can set up trends to trade on trend change, as well. Buy in an upward trend and sell when it turns downward.
Step 3. Set Up Price Indicators. First see if the trailing buy or V-buy will trade profitability with your trailing sells or stop losses.
Step 4. Set Up the Volume Indicator. This tool will trade on the average bar volume (e.g. Moving Average of 100 days). For example, the user may set this to buy an equity when the MA exceeds 200 percent, with a green on a green (upward) candle. It’s able to prevent trades above or below a volume baseline, affecting other indicators.
Step 5. Set up Oscillators. Test out the Relative Strength Index or the Bull Market Support Band. It may also be advantageous to tryout the Master Baseline Support Indicator (MBSI). The MBSI can also be used to set up trading channels, if other indicators don’t work to the user’s advantage. The MBSI can also set a baseline to trade or not to trade, such as preventing buys below the 200-day Exponential Moving Average.
Step 6. Set Up Safeties and Flat Mitigation. These tools prevent trading of other indicators. For example, the Safety can be set to prevent another buy for seven periods if, in the previous 14 periods, there were two losing trades. The Flat Mitigation checks so many periods backwards and compares current periods. If the percentage of change is too low (flat or ranging sideways), the tool will prevent trading. This mitigates getting a series of buys and sells that tend to chew down your account balance.
Different Strokes for Different Folks. We encourage you to experiment with other set up ordering. The above steps have worked well for the developers, but occasionally even we’ll attempt different ordering as we see success patterns develop. For example, sometimes we can look at trading patterns and “feel” that a trading band strategy may work well. In such cases we’ll test our intuition before doing anything else.
Next: Now that you’ve learned about the bot, how about a free 14-day subscription.